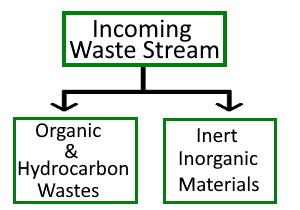
Material Recovery Facilities MRF
Municipal & Curbside Recycling
Size Reduction - Size Fractions NEXT
2024 Annual USA Recycling Rates
Recovery 2.0 - Material Recovery Yields
| WasteStream | Hydrogen | Carbon | Water | Other |
| Mixed Plastic Waste | 55-65% | 35-40% | 0-5% | 0-10% |
|
Solid Recovered Fuel
|
15-30% |
15-30% |
25-45% |
15-25% |
| Wood, Paper & Biomass | 15-20% | 25-30% | 40-60% | 0-2% |
| Food & Organic Wastes | 8-12% | 8-12% | 75-80% | 0-2% |
Hydrogen Recovery Yields
yield per metric tonne (1,000 Kg) by wastestream
| WasteStream | Hydrogen Yield | Dry Feedstocks |
| Mixed Plastic Waste | 250 Kg. |
|
|
Solid Recovered Fuel
|
70 Kg. |
|
| Wood, Paper & Biomass | 16 Kg. | 40 Kg. |
| Food & Organic Wastes | 15 Kg. | 75 Kg. |

Carbon Recovery Yields
yield per metric tonne (1,000 Kg) by wastestream
| WasteStream | Carbon Yield | Dry Feedstocks |
| Mixed Plastic Waste | 750 Kg. |
|
|
Solid Recovered Fuel
|
430 Kg. |
560 Kg. + |
| Wood, Paper & Biomass | 384 Kg. | 960 Kg. |
| Food & Organic Wastes | 185 Kg. | 925 Kg. |
Water Recovery Yields
yield per metric tonne (1,000 Kg) by wastestream
| WasteStream | Water Yield | Dry Feedstocks |
| Mixed Plastic Waste |
|
|
|
Solid Recovered Fuel
|
250 Kg. |
|
| Wood, Paper & Biomass | 600 Kg. |
|
| Food & Organic Wastes | 800 Kg. |
|
Annual USA Recycling Rates
Estimated for 2024
| Commodity Type |
Metric Tonne
per year |
| Asphalt Reclaim | +/- 100 million |
| Scrap Steel | +/- 80 million |
| MSW/MRF Recovery | 69 million |
| Waste Paper | +/- 50 million |
| Industrial Plastic Scrap | 12 to 22 million |
| Electronics E-Scrap | 9.3 million |
| Scrap Tires | 4.0 million |
| Scrap Aluminum Recycling | 3.3 million |
| Scrap Glass | 3.1 million |
| MRF Plastics | 2.76 to 3.45 million |
| Battery - lead/acid | 2.9 million |
| Textiles Wastes | 2.5 million |
| Copper Scrap | 830,000 |
| Gypsum & Drywall Scrap | 700,000 |
| Magnesium (Mg) | 103,000 |
| Tin (Sn) | 17,000 |
| Silver Recovery | 1,700 |
| Scrap Gold Recycling | 90 |